Often the focus of risk management in an organisation is on the content of risk registers, with monitoring and reporting on treatment actions and periodic risk reviews.
What is often overlooked or underestimated are the elements that make up the risk assessment matrix and their veracity, which can have a significant effect on risk assessment and subsequent decision making.
In this blog, we will explore those key elements and how you can critically assess whether you are getting the most out of them for your organisation and the business it undertakes.
What is the Risk Assessment Matrix?
A risk assessment matrix is a quantitative tool used in risk management to systematically evaluate risks by mapping them based on their likelihood of occurrence and the magnitude of their impact. This matrix serves as a decision-making framework, enabling organisations to categorise risks into various levels of severity, from low to critical, and assign appropriate mitigation strategies. By integrating data such as probability distributions and historical incident rates, the risk assessment matrix ensures a more accurate, consistent, and objective analysis of potential threats. This approach is essential for prioritising risk treatments, enhancing governance, and supporting risk-informed decision-making across business units.
Key Elements of the Risk Assessment Matrix
- Consequence Table: the ISO 31000:2018 Risk Management Guidelines defines Consequence as “the outcome of an event affecting objectives”. It can be:
- certain or uncertain and have positive or negative direct effects on objectives
- expressed qualitatively or quantitatively
- escalated through cascading and cumulative effects
Selection can be assisted with the use of quantitative data e.g., loss event records for the financial consequence category.
- Likelihood Table: the ISO 31000:2018 Risk Management Guidelines defines Likelihood as “the chance of something happening”. It can be:
- defined, measured, or determined objectively or subjectively, qualitatively or quantitatively, and described using general terms or mathematically (such as probability or a frequency over a given time period)
- used with the intent that it should have the same broad interpretation as the term “probability”
Selection can be assisted with the use of quantitative data e.g., incident statistics.
5×5 is the most common configuration, but there are several variations, e.g., 10×5 (with consequence, threat, and opportunity ratings), 6×6, 4×4, and 3×3.
Critically Assessing Your Approach
Consequence Table:
- Look at the most significant impact/consequence categories for your business together with the organisation’s highest rating risks to determine those categories to be built out in the consequence table. Are there any missing from your current consequence table?
- Look for generalised or subjective descriptions that make it difficult to distinguish between rating levels, e.g., moderate to high, or high to very high.
- Some risk types/registers may require specific categories or sub-categories
- Check that the description is unique to the category of risk it applies to
Likelihood Table:
- A frequency and probability are more informative than a general description
- Do the settings for probability and frequency adequately capture the highest rated risk event occurrence and adequately capture the range values? Look at any relevant incident data held by the organisation or accessible through benchmark data associated with these risks
Risk Heat Maps:
- The heatmap relates to the Consequence and Likelihood table selections, so in determining the layout, truth check it against the wording in these tables and the high impact risks in the main risk types/registers – is the heatmap configuration consistent with the risk posture of the organisation?
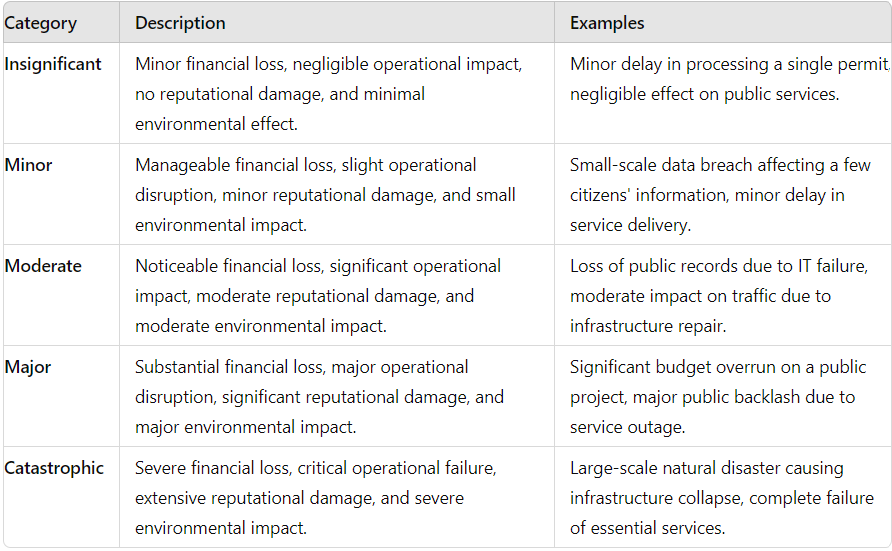 Figure 1.1: An example of a Consequence Table
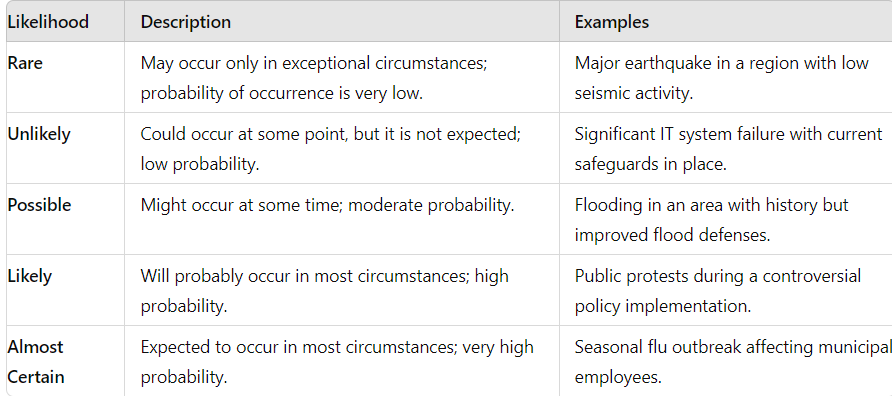 Figure 1.2: An example of a Likelihood Table
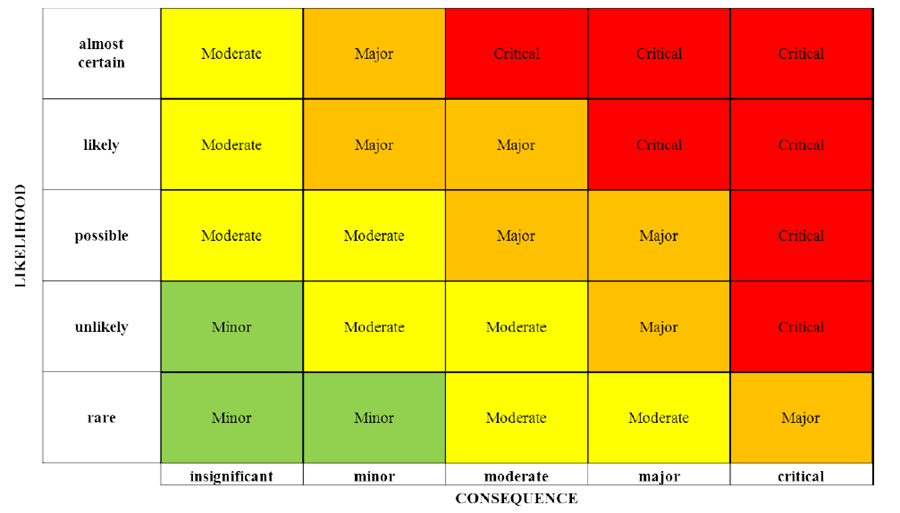 Figure 1.3: An example of a Heat Map
Enhancing Risk Assessment with Camms Solutions
Camms provides a powerful suite of tools to optimise your risk assessment matrix. Features include:
- Customisation: Camms allows you to tailor risk matrices to your organisation’s specific needs, ensuring that your risk assessments are aligned to your risk framework elements.
- Advanced Analysis: Go beyond basic configurations to add additional factors like risk aggregation, control attestation and complex calculations, that enable further insight into risk assessment.
- Visualisation and Reporting: Camms offers advanced reporting features, including dashboards and interactive heat maps, that clearly display risk levels, assessment trends and pop-up summary data, which aids analysis and decision making.
- Ongoing Support: Camms evolves with your organisation, offering continuous support to keep your risk management practices aligned with changing needs. By utilising the expertise of a Virtual Consultant, you can significantly enhance the effectiveness of your risk assessment matrix, resulting in improved risk management and more informed decision-making across your organisation.
What's in It for Your Organisation?
By implementing these strategies, you can expect several tangible benefits:
- Improved Accuracy in Risk Assessment: With clearer definitions and the use of more quantitative data, your risk assessments will be more precise, supporting better decision-making.
- Increased Understanding of the Risk Assessment Process: A well-constructed risk assessment matrix provides stakeholders with a clear and logical set of tools, that can build a better understanding of the risk assessment process and ensure that everyone is on the same page.
- Enhanced Compliance and Governance: Camms enables you to standardise risk workflows and assessment procedures for different risk types to meet compliance and governance requirements across your organisation.
Conclusion
Risk matrices, despite some limitations, remain an essential tool in risk management. By understanding their components and addressing common issues, you can significantly enhance your organisation’s risk assessment and decision-making processes.
Incorporating these practices will improve your overall risk management framework and better equip those in your organisation to confidently and consistently assess risks and opportunities for improvement.
Join the Camms Community for insightful discussions on the Risk Assessment Matrix and other critical risk management topics. Connect with experienced experts and fellow users to explore the platform’s features in-depth and enhance your risk management approach.