Click Here to Explore Resources
Explore


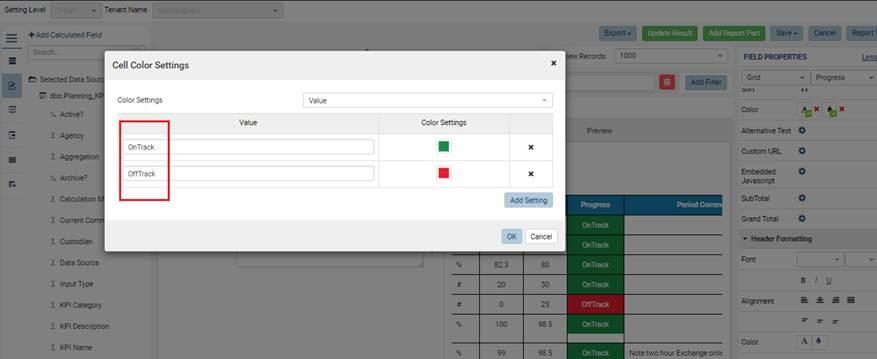
You have to ensure that the value in the cell matches the value you have set up in the conditional colour setting.
In the below example the values of the ‘Progress column are in sentence case but the cell colour settings have been applied to the all caps version of the same words.
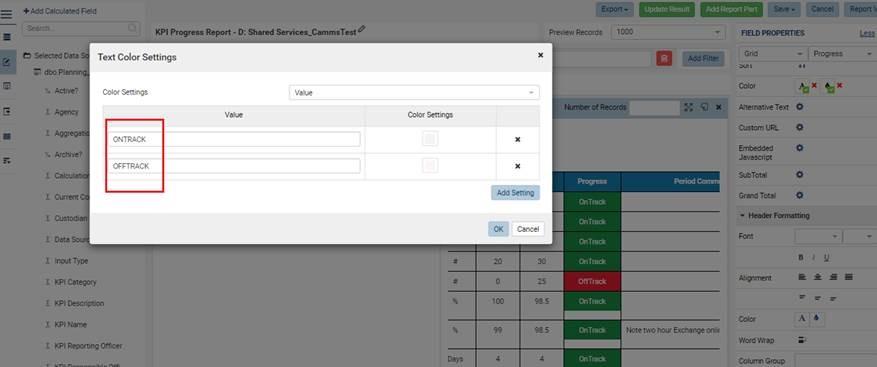
To fix, change the values as shown below:
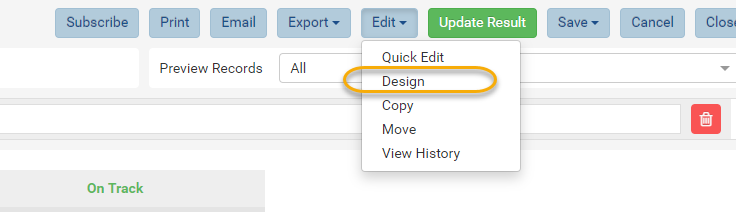
To schedule reports for others you do this through the DESIGN mode of the individual reports:
Step 1: Open the report you want to schedule and click EDIT > Design:
Step 2: Click on ‘Schedule’ button on the left hand side menu:
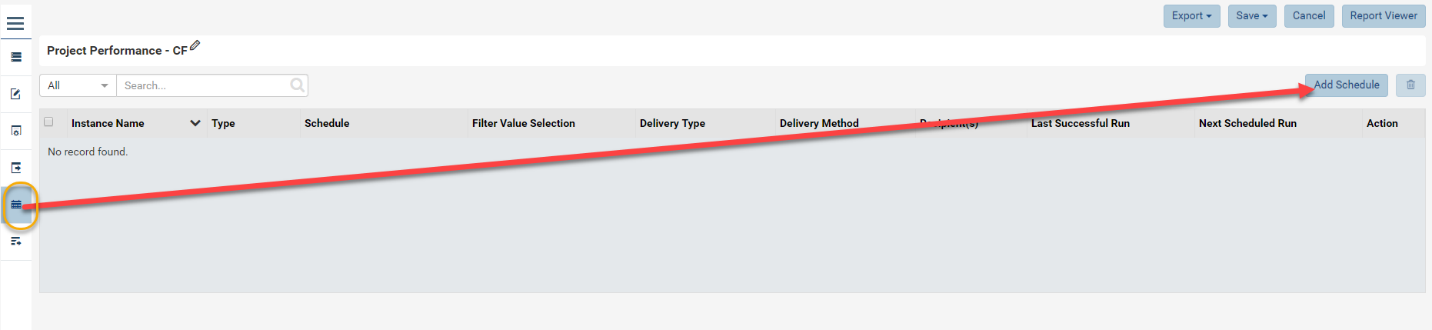
Step 3: Click ‘Add Schedule’
![]()
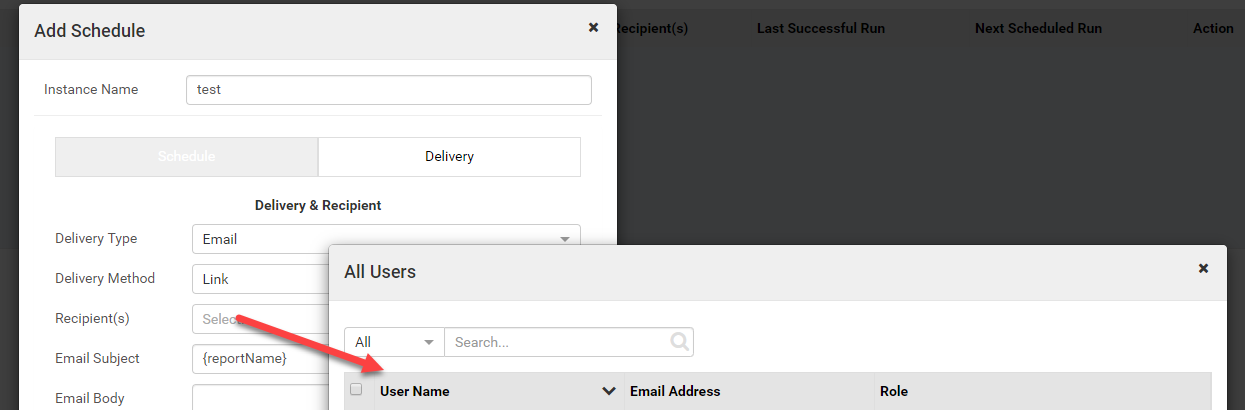
Step 4: Fill out the ‘Schedule’ and then ‘Delivery’ section. As part of the Delivery Section you select the Recipients:
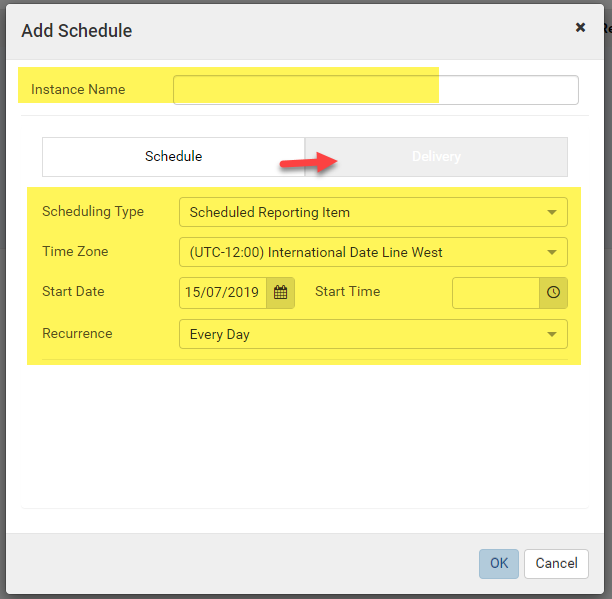
Step 5: Click ok and the schedule has been set on the page.
Note: check to ensure under USERS that the recipients have email addresses to ensure they are sent correctly.
Reports and Dashboards are set to export to Portrait orientation by default.
To change this for a Report, go to the Report Designer > Exporting tab and choose the Landscape orientation using the dropdown as shown.
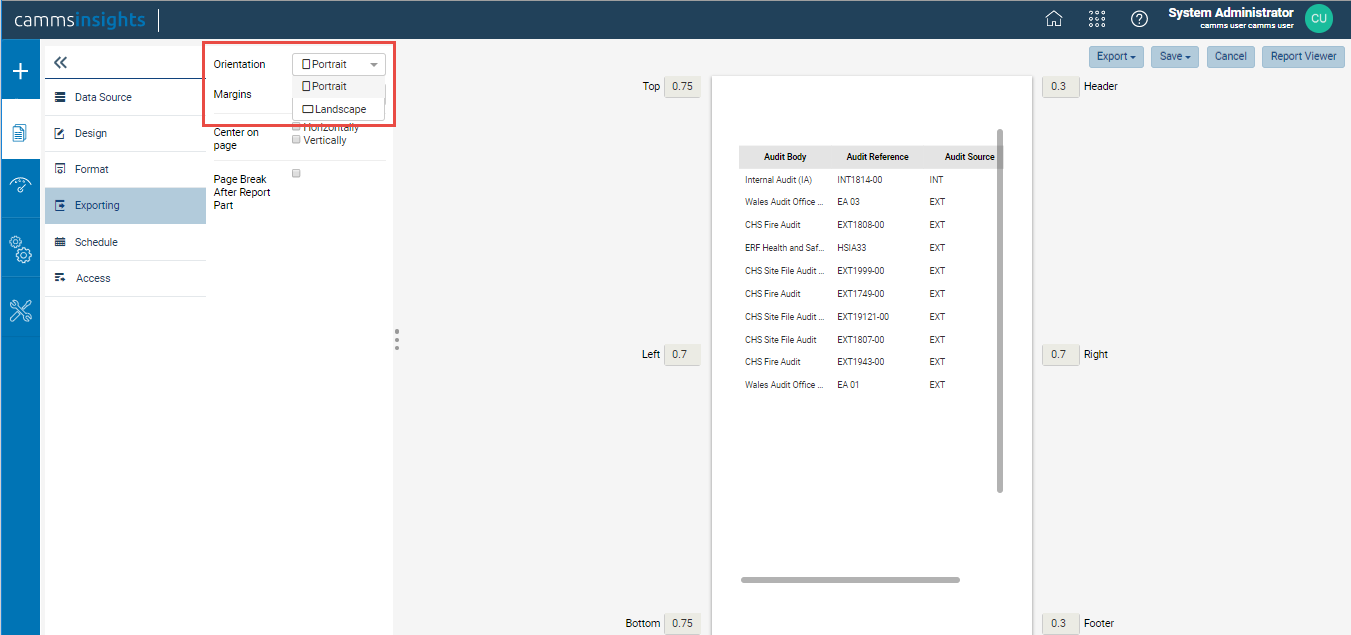
Dashboards unfortunately can only be exported in Portrait orientation at this stage.
cammsinsights introduced seventeen new datasets to correspond to matching functionality in cammsrisk with the August sprint release, 2019. With these new datasets, the below mentioned existing datasets will be phased out and they will not receive future updates from CAMMS.
Any reports created using these datasets will continue to function however, they will not reflect configuration changes you make in future such as new field additions. Therefore, Insights Administrators and Report Designers are advised to discontinue using these going forward and use the new datasets instead.
Following are the new datasets included in this release:
New Strategic Risk datasets:
New Corporate Risk datasets:
New Operational Risk datasets:
New Project Risk datasets:
New dataset replacing the current Risk_RiskActionDetails_STND dataset:
Following are the default relationships for the new datasets;
Default relationships are all Inner Joins
Risk_StrategicRiskInitial_STND vs Risk_StrategicRiskRevised_STND on RISKID
Risk_StrategicRiskInitial_STND vs Risk_StrategicRiskFuture_STND on RISKID
Risk_CorporateRiskInitial_STND vs Risk_CorporateRiskRevised_STND on RISKID
Risk_CorporateRiskInitial_STND vs Risk_CorporateRiskFuture_STND on RISKID
Risk_OperationalRiskInitial_STND vs Risk_OperationalRiskRevised_STND on RISKID
Risk_OperationalRiskInitial_STND vs Risk_OperationalRiskFuture_STND on RISKID
Risk_ ProjectRiskInitial_STND vs Risk_ ProjectRiskRevised_STND on RISKID
Risk_ ProjectRiskInitial_STND vs Risk_ ProjectRiskFuture_STND on RISKID
Risk_StrategicRiskInitial_STND vs Risk_StrategicRiskReview_STND on RISKID
Risk_CorporateRiskInitial_STND vs Risk_CorporateRiskReview_STND on RISKID
Risk_OperationalRiskInitial_STND vs Risk_OperationalRiskReview_STND on RISKID
Risk_ProjectRiskInitial_STND vs Risk_ProjectRiskReview_STND on RISKID
Risk_StrategicRiskInitial_STND vs Risk_RiskControlDetails_STND
Risk_CorporateRiskInitial_STND vs Risk_RiskControlDetails_STND
Risk_OperationalRiskInitial_STND vs Risk_RiskControlDetails_STND
Risk_ ProjectRiskInitial_STND vs Risk_RiskControlDetails_STND
Risk_StrategicRiskInitial_STND vs Risk_RiskSolutionDetails_STND on RISKID
Risk_CorporateRiskInitial_STND vs Risk_RiskSolutionDetails_STND on RISKID
Risk_OpertationalRiskInitial_STND vs Risk_RiskSolutionDetails_STND on RISKID
Risk_ProjectRiskInitial_STND vs Risk_RiskSolutionDetails_STND on RISKID
Risk_StrategicRiskInitial_STND vs Risk_RiskLinks_STND
Risk_CorporateRiskInitial_STND vs Risk_RiskLinks_STND
Risk_OperationalRiskInitial_STND vs Risk_RiskLinks_STND
Risk_ ProjectRiskInitial_STND vs Risk_RiskLinks_STND
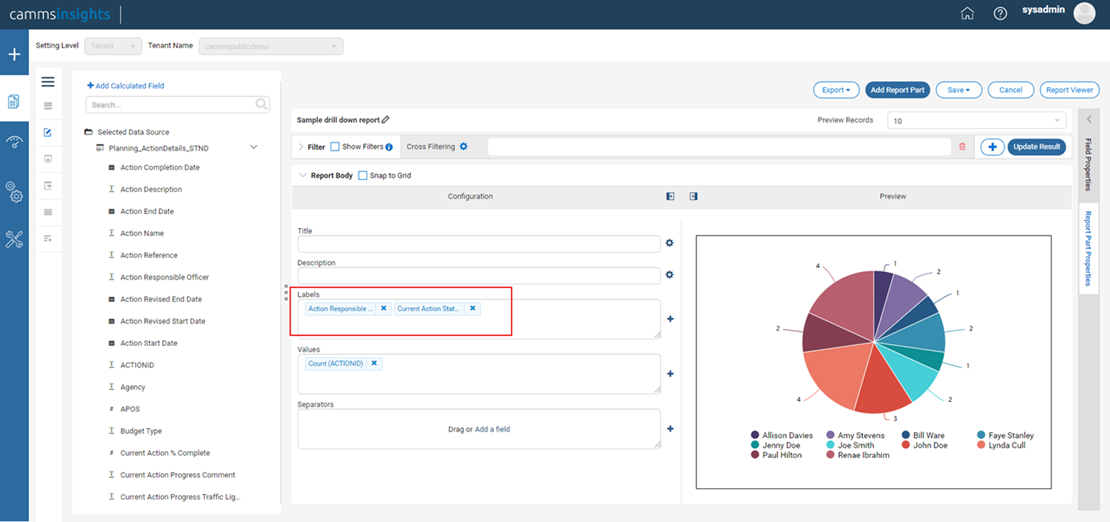
Most chart types can be converted to drill downs by adding multiple fields to the “Labels” box as shown below. This indicates that the fields on the left will be partitioned by the fields to the right as a user clicks on individual chart segments.
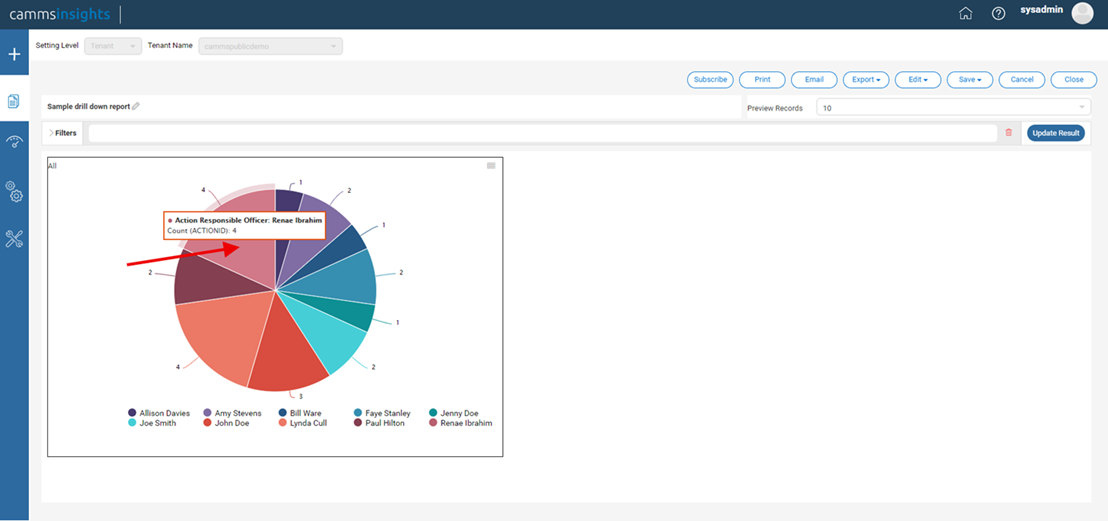
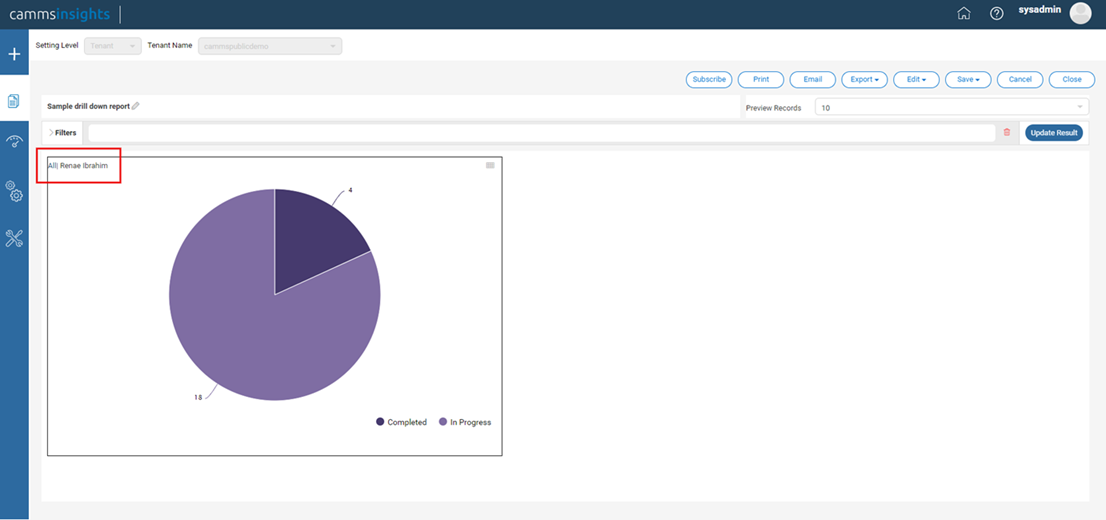
To utilise the drill down, click on a slice, such as ‘Renae Ibrahim’ in the example below. Doing so will display the next level of partitioned data – this example shows the number of Actions per Responsible Person first, then when you click on a specific Responsible Person segment, it shows the number of Actions per Status.
To go back up the drilldown, follow the breadcrumb available at the top left corner of the chart.
The Template Break option in Design Forms is due to be removed by Izenda – it does not currently serve any function.