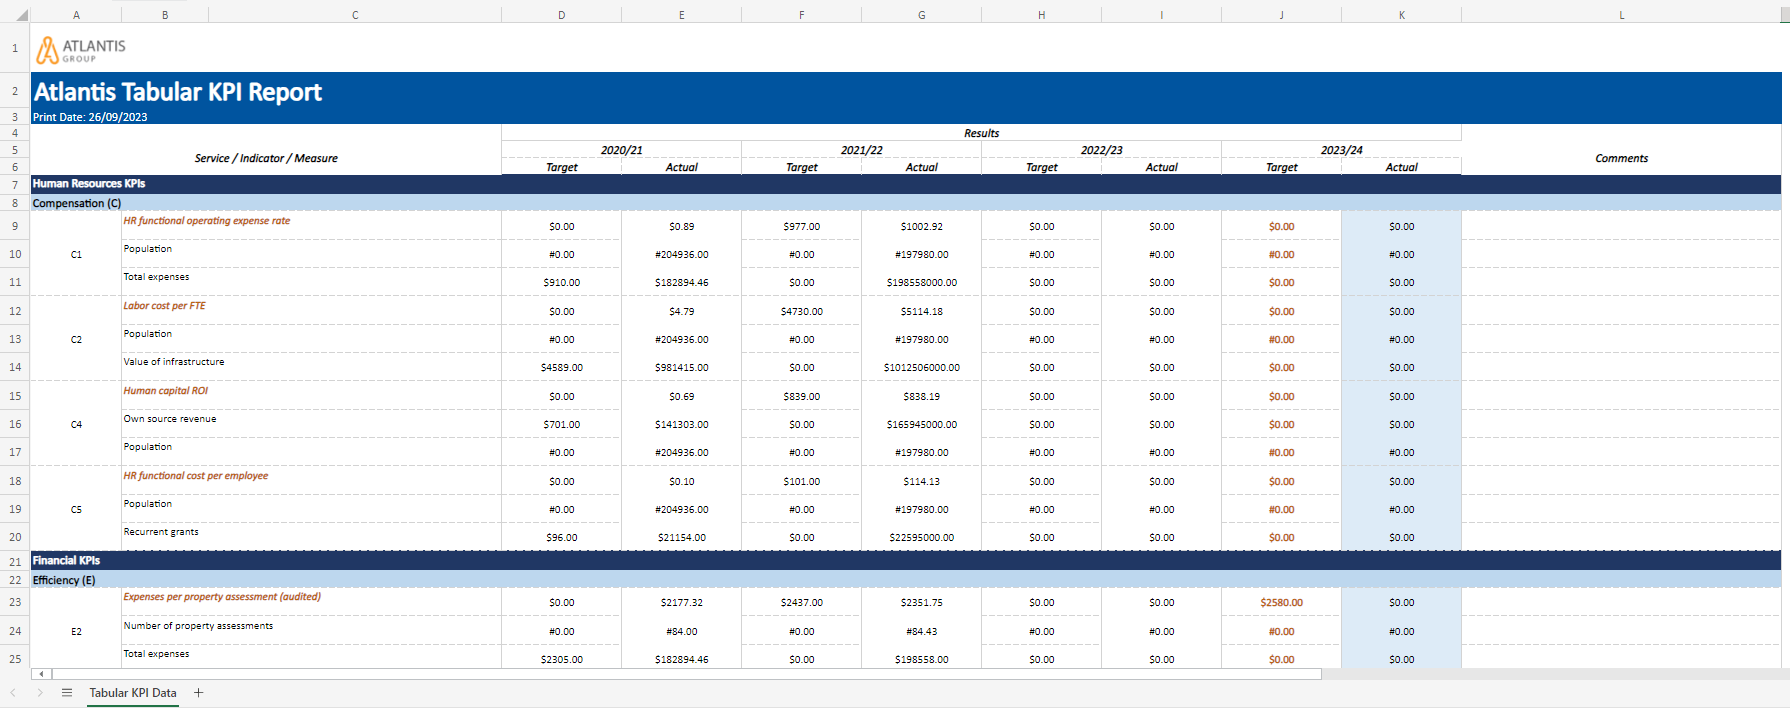
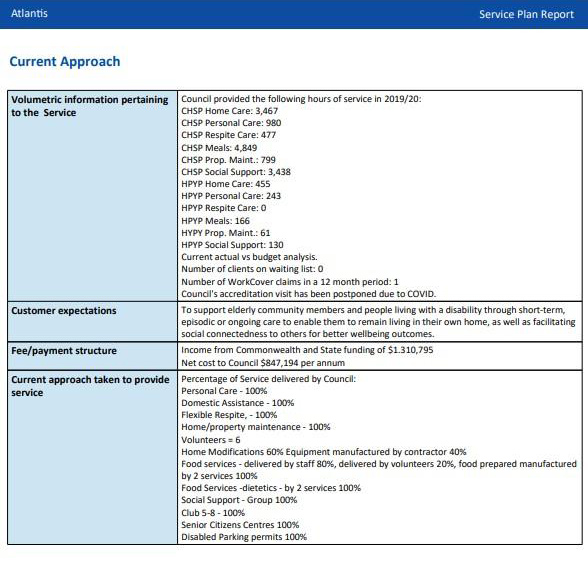
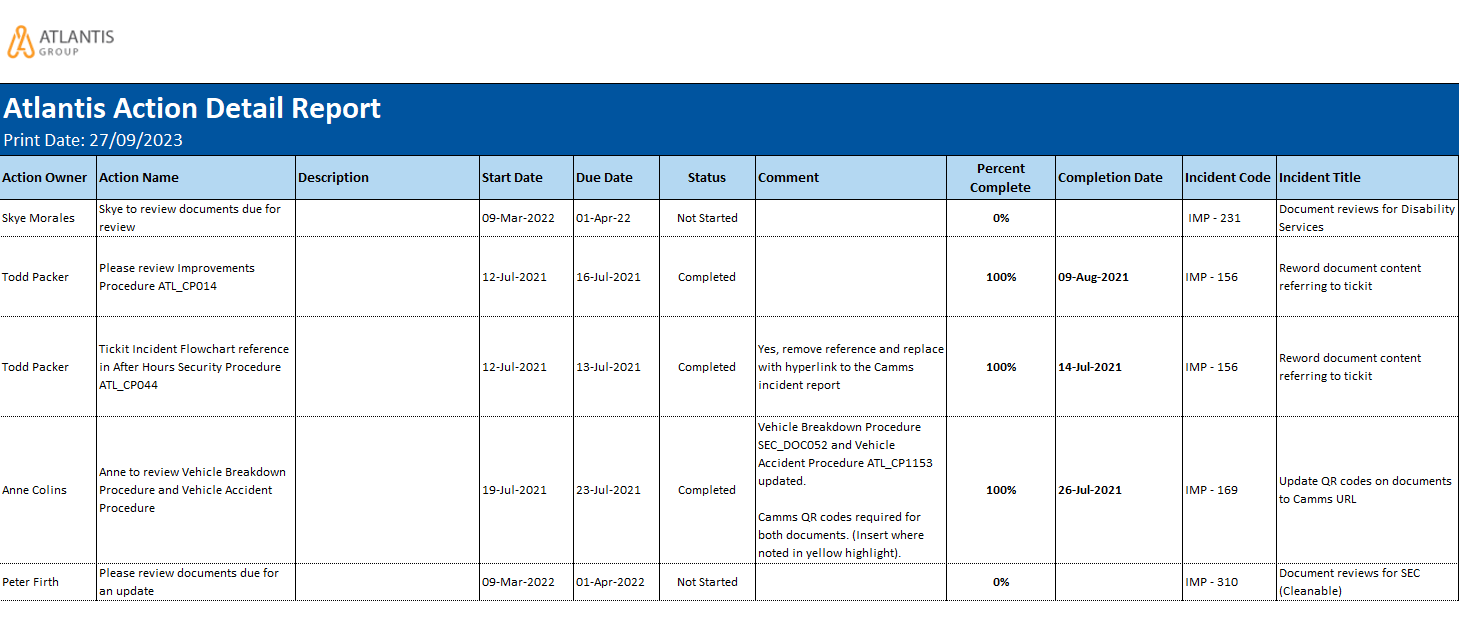
At Camms, relentless innovation and continuous improvement are at the heart of our mission. Our latest cutting-edge SSRS reports, and Power BI dashboards have been meticulously designed for simplicity and speed, promising to transform your experience in accessing and leveraging data across diverse Camms solutions. These new tools represent our unwavering commitment to providing clients with the most advanced reporting solutions available.
With Camms reports and dashboards, you can:
- Get the most value from your data: Turn your data into valuable insights to make the decisions that move your business forward.
- Increase data literacy: Create a data-driven culture by making it easy for employees of all skill levels to explore trends, share insights, and take action.
- Turn your data into insights: Explore ready-to-use Power BI dashboards and SSRS reports by industry to experiment with sample KPIs, data sources, and visualisations. Our dashboards and reports encompass a range of categories, including Analytical, Strategic, Operational, and Tactical, enabling you to dive deep into data tailored to your specific needs.
- Gain stakeholder buy-in: Present key KPIs to stakeholders in a way they can readily understand to ensure alignment and support for your data-driven initiatives.
- Personalise your data experience: Craft real-time, interactive dashboards that guide individuals through complex data, creating personalised experiences and telling engaging data stories.
- Deliver impactful visual insights: Use data visualisations to ignite real-time insights and on-the-fly analytics on any desktop or mobile device, ensuring your teams can access critical information from anywhere.
- Empower smart decisions: Empower your teams to make a measurable business impact by providing them with the visual insights they need to understand and act on the data effectively.
This blog reveals how Camms reports, and Power BI dashboards empower users to create interactive reports, fostering growth through data management. We'll also unveil the latest Power BI dashboards and SSRS reports, explore optimising in-house reporting, discuss virtual consulting advantages, and introduce the time and cost-saving potential of Camms' Custom Reporting.
Dashboards vs. Reports: Which One Should You Choose?
Dashboards and reports are both valuable tools for businesses of all sizes, but they have different purposes and are best suited for different situations.
Empowering Data-Driven Decision-Making with Power BI Dashboards
Dashboards serve as a powerful tool in today’s data-driven world, offering a concise and real-time snapshot of vital metrics and trends. Typically presented on a single screen, they employ interactive data visualisation to make complex information instantly comprehensible. These dynamic displays are especially valued by executives and managers for tracking key performance indicators (KPIs) and facilitating swift, informed decision-making.
In the pursuit of enhancing data insights, Power BI emerges as a game-changer. Its unique capability to harmonise diverse data sources into a unified, visually immersive, and interactive format is indispensable. With Power BI, the seemingly unrelated data streams seamlessly merge, unveiling a crystal-clear, dynamic perspective of your organisation’s vital information.
Unlocking Professional Paginated Reporting with SSRS
SSRS (SQL Server Reporting Services) excels in crafting highly customisable, professional reports, designed for output to various formats, from PDF and Word to Excel. Its key attributes encompass user-friendly parameterisation, adaptable data grouping, complex calculations, and custom expressions. Static multi page reports, as opposed to dynamic snapshot dashboards, offer the ability to print lengthy content which can be enriched with tables, charts, graphs, text, and narrative. With SSRS, accessing comprehensive and actionable reporting becomes effortless, making it an invaluable tool for data-driven excellence.
Maximising Your Camms Solution: A New Era of Analytics and Reporting
Camms’ reports and dashboards revolutionise Camms solution utilisation by offering interactive analytics and customised data experiences. These tools enable rapid, informed decisions, replacing outdated methods with modern, real-time reporting. Accessible dashboards not only display data but also tell engaging data stories with real-time insights.
Now, let’s explore how Camms’ reporting solutions can transform your experience with various Camms modules:
Camms.Risk: Effective Risk Management Insights
For organisations relying on Camms.Risk, robust risk management is paramount. Our reports deliver a comprehensive view of your risk landscape, empowering you to make data-informed decisions. Here’s how Camms.Risk reporting can benefit your organisation:
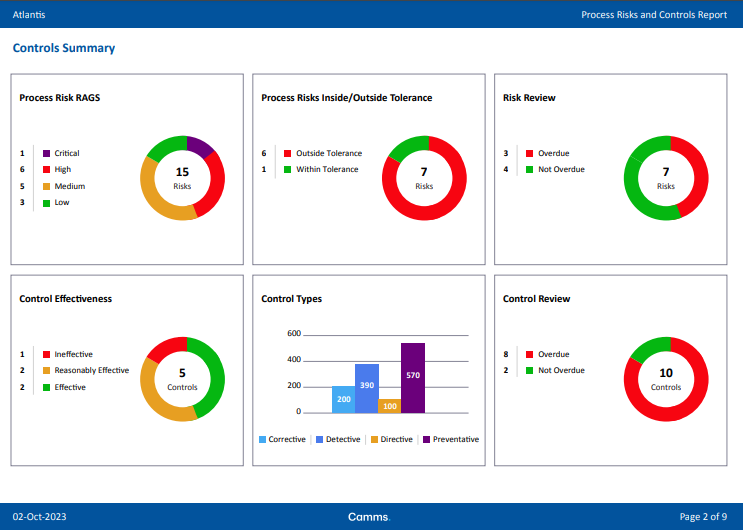
Risk Assessment: Understand your organisation’s risk exposure and assessment with Camms.Risk reports.
Risk Mitigation: Identify and mitigate risks to prevent disruptions. Our reports help you develop and monitor risk mitigation plans.
Compliance Monitoring: Track compliance status and highlight non-compliance with Camms.Risk reports.
Risk Performance Metrics: Evaluate risk management performance using key Risk Indicators (KRIs) to improve processes and readiness.
Trend Analysis: Detect recurring risk trends and patterns to proactively address them.
Click here for the latest SSRS reports and Power BI dashboards for Camms.Risk.
Camms.Project: Streamlined Project Management Insights
For organisations relying on Camms.Project, effective project management is key. Our reports and Power BI dashboards provide a comprehensive view of your projects, helping you make data-driven decisions. Here’s how Camms.Project reporting can benefit your organisation:
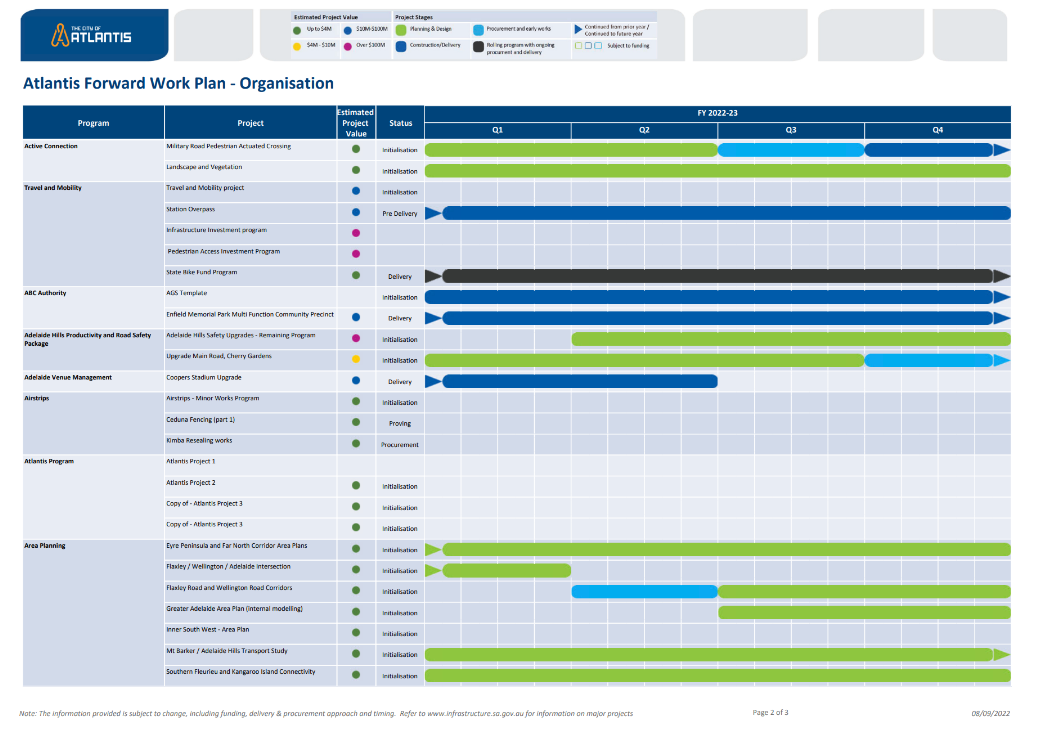
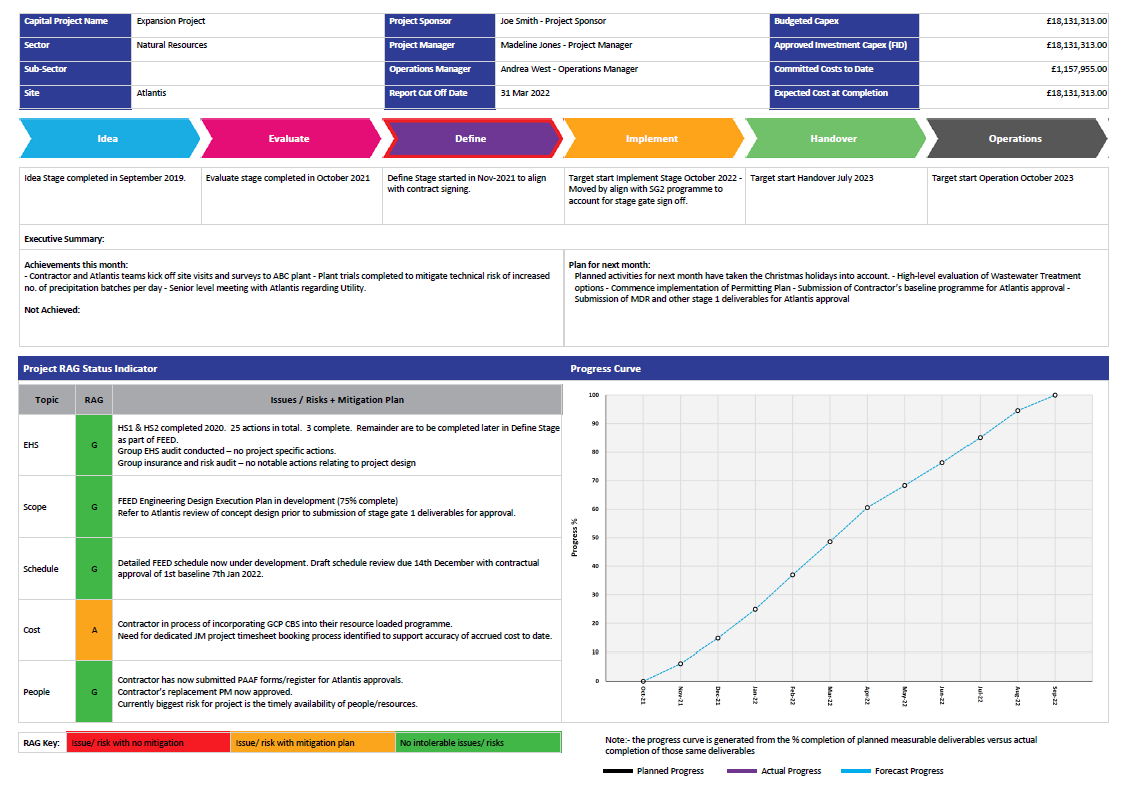
Project Status Overview: Monitor project status, track progress, and keep projects on track with our project status dashboards.
Budget Management: Keep projects on budget and resources allocated efficiently with Camms.Project reports.
Resource Allocation: Optimise resource allocation and utilisation with insights from our reports.
Risk Identification: Stay ahead of risks and maintain project momentum with Camms.Project risk reports.
Click here for the latest SSRS reports and Power BI dashboards for Camms.Project.
Camms.Strategy: Strategic Decision Support
In the realm of Camms.Strategy, making informed strategic decisions is paramount. Our SSRS reports are designed to provide strategic insights:
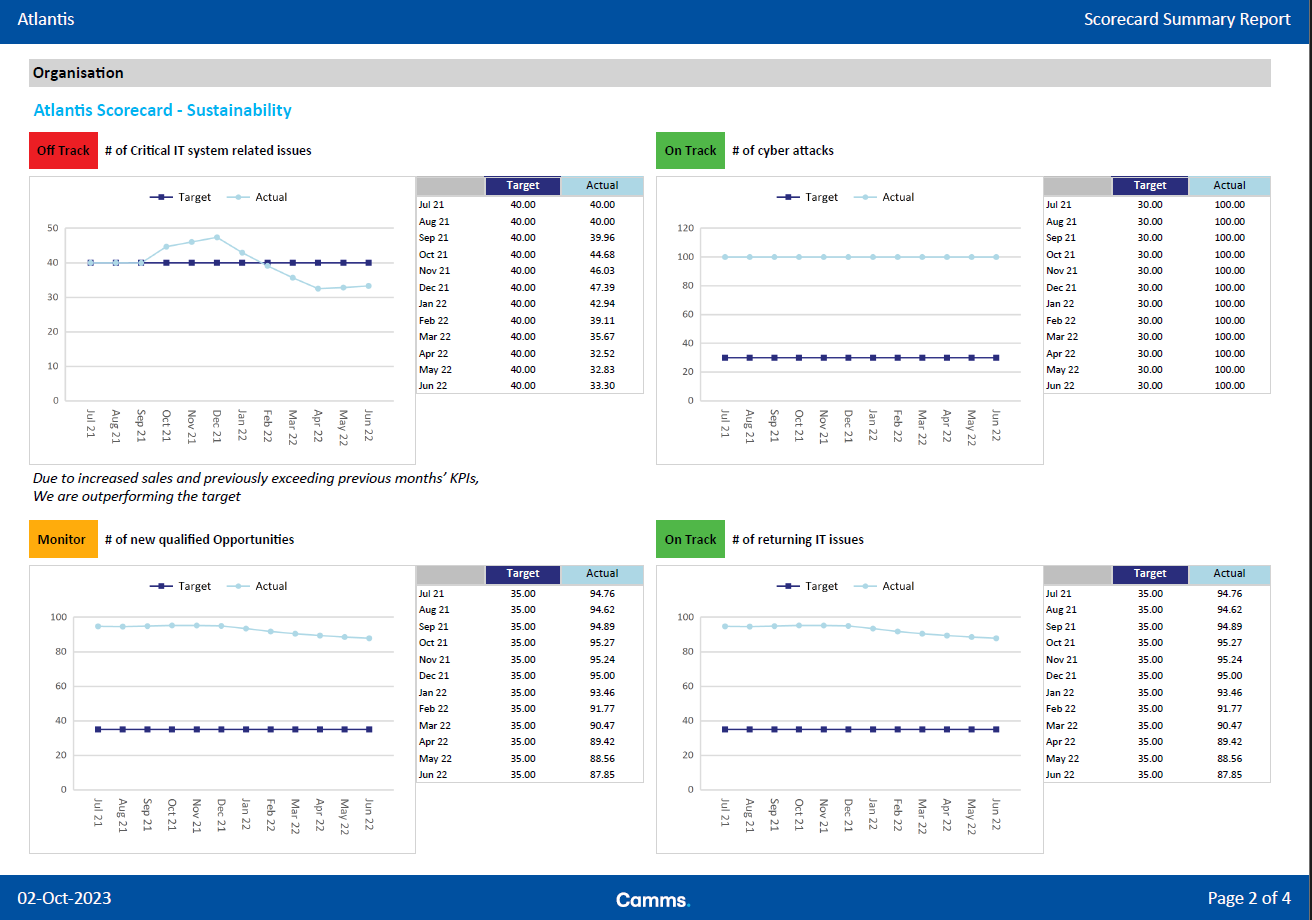
KPI Monitoring: Monitor KPIs with strategy reports. Visualise trends, track performance, and ensure you meet strategic objectives.
Strategic Action Items: Dive into strategic action items with our reports. Assess progress and align your team with strategic goals.
Performance Scorecards: Get a comprehensive view of performance with scorecards that display KPI scores and trends. Empower strategic leaders to make data-driven decisions.
Budget and Cost Analysis: Understand the financial implications of strategic initiatives with our reports. Ensure strategic decisions align with financial goals.
Click here for the latest SSRS reports and Power BI dashboards for Camms.Strategy.
Camms.Risk Compliance: Ensuring Regulatory Adherence
In today’s regulatory environment, compliance is a top priority. Camms.Risk Compliance SSRS reports help your organisation maintain compliance:
Obligation Management: Monitor your organisation’s obligations with compliance reports.
Authority Document Tracking: Track authority documents to ensure compliance.
Policy Compliance: Ensure policy adherence with compliance reports.
Audit Trail Analysis: Track and analyse audit trail data to meet compliance requirements.
Click here for the latest SSRS reports and Power BI dashboards for Camms.Risk Compliance.

Camms.Risk Incident: Managing Incidents Effectively
Incidents can be disruptive, and effective incident management is essential. Camms.Risk Incident reports and Power BI dashboards streamline incident management:
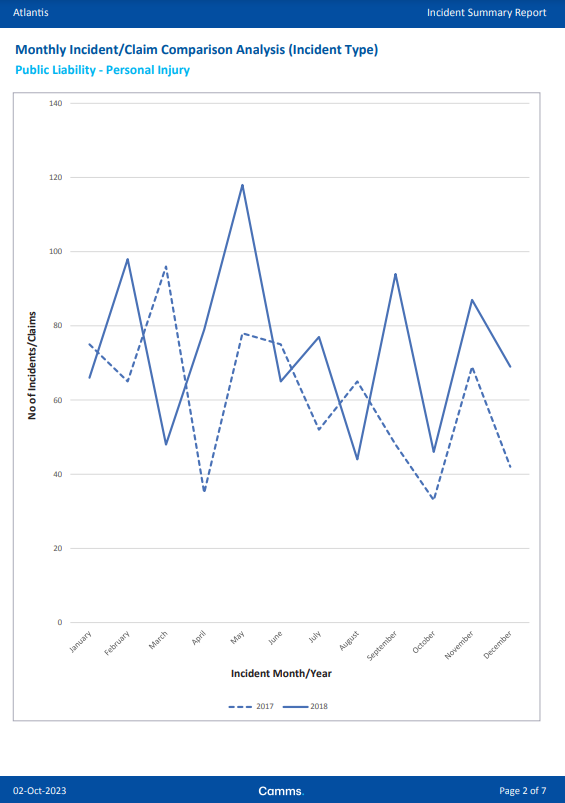
Incident Tracking: Track incidents from minor to major with Camms.Risk Incident reports and analysis.
Incident Categories: Gain insights into incident types and categories to identify patterns and areas for improvement.
Performance Metrics: Evaluate incident management performance with metrics and KPIs to enhance response processes.
Trend Analysis: Detect incident trends and patterns over time to take preventive measures.
Click here for the latest SSRS reports and Power BI dashboards for Camms.Risk Incident.
Simplify Your Reporting Processes with Camms.College
If you’re a Camms.College subscriber, you have access to Virtual Consulting, a valuable resource that can help you simplify your reporting and dashboarding processes. With Virtual Consulting, you can leverage your subscription to get the reporting support you need, when you need it.
What’s in it for you?
- Get help with a wide range of reporting tasks, from building dashboards and creating custom reports to troubleshooting and training.
- Work with a Reporting Consultant who has the expertise and skills to meet your specific needs.
- Save time and money by using Virtual Consulting to outsource your reporting needs.
How it works
Don’t let your Virtual Consulting hours go to waste! Book a Reporting Consultant from our team and unlock the full potential of Camms.
Your consultant will work with you to understand your needs and develop a plan, then help you with any reporting task, big or small, to streamline your processes and make the most of your Camms investment.
Book an expert consultant from our reporting team here.
The future of reporting is here, and we’re excited to embark on this journey with you. Join us in this new era of data-driven decision-making, where your success is our ultimate goal. Try out the new reports and dashboards and share this blog post with your colleagues who can benefit from it.
To know more about our latest reports and dashboards, and how to produce highly effective reporting and dashboarding outputs, register for our upcoming webinar; From Data to Decisions: Mastering Insights with New SSRS Reports and Power BI Dashboards.


