Camms.Connect

Power BI helps you combine your unrelated data sources into coherent, visually immersive, and interactive insights. Keep reading to find out how Camms can help you to implement and integrate this into your business’ reporting processes.
The 21st Century has become the most competitive era with innovations and competition on surge. Understanding every detail about your company and how these learnings can be applied is of utmost importance to give your business a competitive advantage. People have less time and higher expectations; therefore, not only is data analysis important but the speed at which it is done is vital too. To understand such valuable information, interactive reporting dashboards play a key role that goes hand in hand with the process of data analysis. Read on to understand how and why data analysis is used, the advantages of Power BI reporting and how Camms supports you to achieve these goals easily!
Data analysis includes evaluating and recapping information, and it can help us understand patterns and trends.
As you might know, businesses nowadays are all shifting to digital processes which means that there is a lot of data around and a big challenge businesses face is that the data is not organised, or is sitting in isolation. A lot of companies are now focusing on data democratisation to ensure everyone has access to data within their company so that everyone is aligned.
This is where Business Intelligence (BI) comes in handy as it combines business analytics, data mining, data visualisation, data tools and infrastructure, and best practices to help organisations make more data-driven decisions.
The key feature in BI technologies that facilitate this, is the ability to access Real-Time Data. BI systems provide users with access to data in real-time through various means including visual dashboards.
Substantial amounts can be comprehended, interpreted, and distributed quickly and accurately when leveraging Business Intelligence tools.
What then is Power BI?
According to Microsoft Docs , Power BI is a collection of software services, apps, and connectors that combine to turn your unrelated data sources into coherent, visually immersive, and interactive insights. Your data may be an Excel spreadsheet or a collection of cloud-based and on-premises hybrid data warehouses – Power BI brings it together to one focal point and presents it with engaging, impressive, reporting methods.
There are three main elements in Power BI including Desktop, Service and Mobile. Power BI Service is an online service hosted on Azure Cloud where you can access the capabilities of viewing, reporting and sharing your dashboard.
Power BI also lets you view in both desktop and mobile so you can access your dashboards however convenient to you
Power BI is dedicated to:
Create amazing data experiences
Easily connect to, model, and visualise your data, creating memorable reports personalised with your Key Performance Indicator (KPIs) and brand. Get fast, AI-powered answers to your business questions—even when asking with conversational language.
Gain insight from your largest BI deployments
Make the most of your big data investments by connecting to all your data sources with the scale to analyse, share, and promote insights across your organisation while maintaining data accuracy, consistency, and security.
Make decisions with confidence
Work together easily on the same data, collaborate on reports, and share insights across popular Microsoft Office applications such as Microsoft Teams and Excel—empowering everyone in your organisation to quickly make data-driven decisions that drive strategic actions.
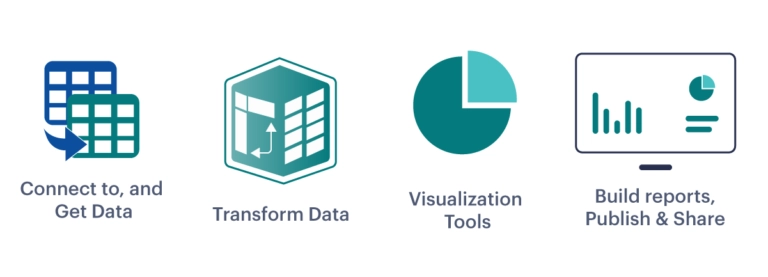
Extraction
Data is the core of Power BI. The first step of how Power BI facilitates data analysis is through extracting it.
Transformation
This stage is similar to a visual editor that allows transformations like sorting, grouping, column splitting, and more.
Visualisation
Visuals are created in the means of report and dashboard designs and then shared with consumers. As a consumer, you can choose to show, export, and analyse the data that was used to create each visual.
In addition to the three processes above, Power BI also facilitates asking questions about your data. You can use Q&A to explore your data by using the intuitive, natural language capabilities of Power BI and receive answers in the form of charts and graphs.
Camms offers a wide range of solutions for organisations to ensure their operations are supported through an out-of-the-box, intuitive and industry-recognised SaaS product suite.
Decide today to transform your manual business processes and keep your team up to speed on business insights by integrating not only our suite of products, but also our reporting capabilities including Microsoft Power BI dashboards. Camms is a Microsoft Power BI partner , and you can find more information about this collaboration on their Partner Portal.
Each solution offered by Camms generates valuable data:
Camms.Project
Allow your business to effectively manage your projects – big or small – in a simple, easy to navigate and understand platform built with the end-user in mind. Overcome the complexities of modern-day projects and portfolio management using a flexible solution that can adapt processes and workflow, integrate with third-party systems and deliver tangible results.
Data generated through Camms.Project allows businesses to understand how effective project management was, which teams collaborated well, which teams were successful and which projects used up the most resources and so on.
Camms.Risk
An integrated approach to Governance, Risk and Compliance.
Make the right business decisions with an easy-to-use solution that provides a comprehensive integrated approach to governance, risk and compliance.
Camms.Risk would enable businesses to recognise organisational opportunities and risk management. An organisation can also identify how efficiently risk was managed if the organisation benefited from it and so on.
Camms.Strategy
Develop and execute your strategy, measure ongoing business performance and ensure your team is working towards a common goal.
The data from Camms.Strategy would most definitely highlight how successful the organisation was at turning its strategy into reality.
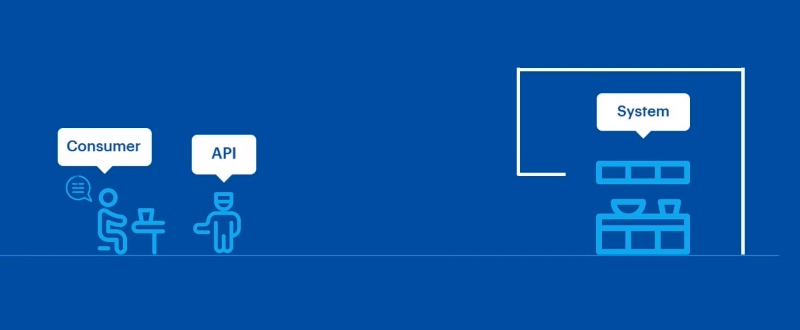
The driving force behind the Power BI capability is our Camms.Connect solution. The data you input to Camms Solutions can be extracted via the use of Camms.Connect – our robust and comprehensive API (Application Programming Interface) solution. The data from these APIs can then be assembled into a Power BI dashboard either using your own in-house Power BI experts or via the assistance of the Camms Reporting Hub . In addition, you can view the data generated from the software as a visual dashboard to get an overview of your entire organisations’s health.
Adding to that, our out-of-the-box Power BI Dashboards are available free of charge from the Microsoft App Source Store. All you need to do is click Install to set it up within your own organisation’s Power BI Workspace and then input your Camms.Connect Subscription on details to get it refreshed with your own data. And that is not all, you can even customise this further to meet your own needs or ask one of our Reporting Agents to do so for you!
Camms currently offers 3 out-of-the-box dashboards free of charge with your purchase of the relevant Camms.Connect API Connector with more on the way later this year.
Refer to the links below for more information on the following dashboards.
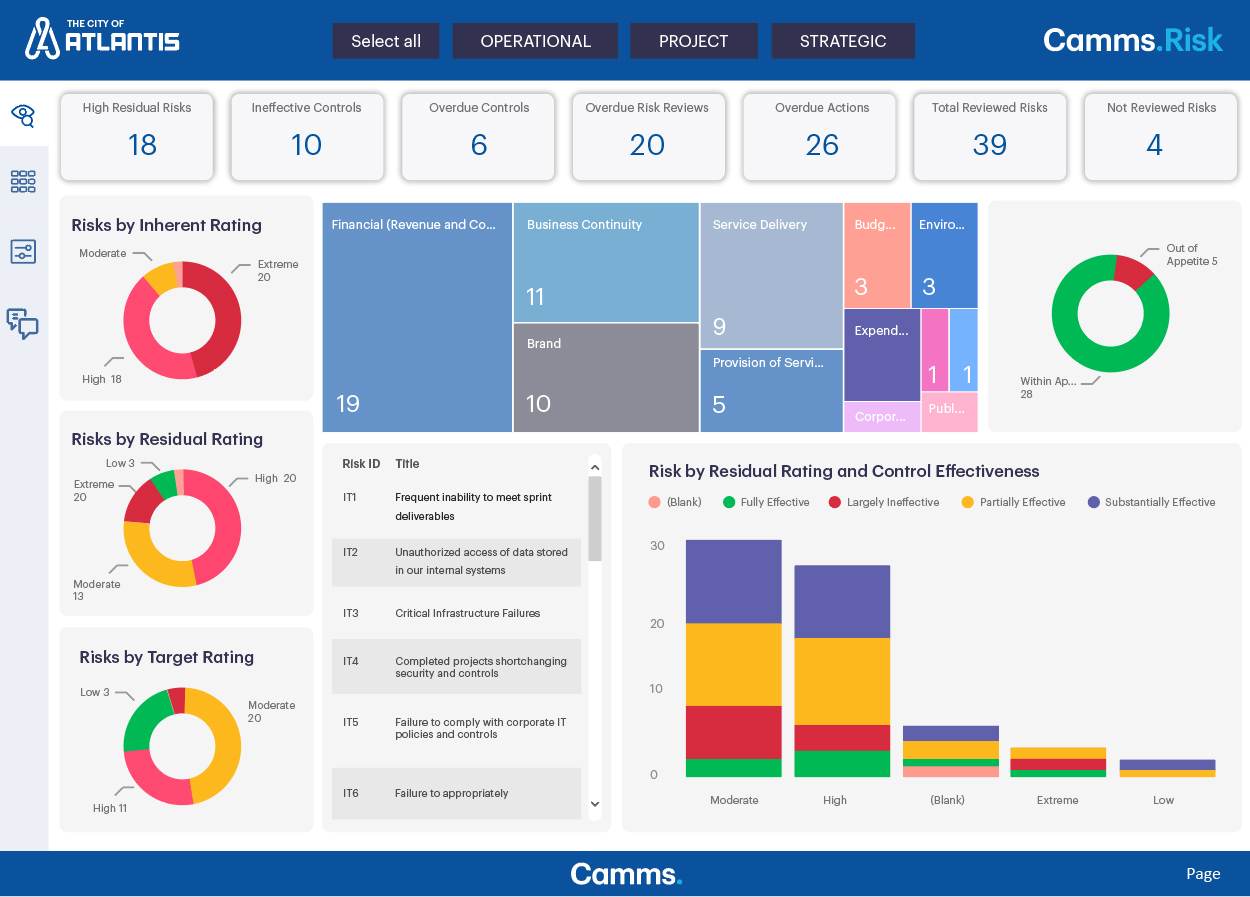 Camms.Risk Dashboard
 Project Portfolio Dashboard
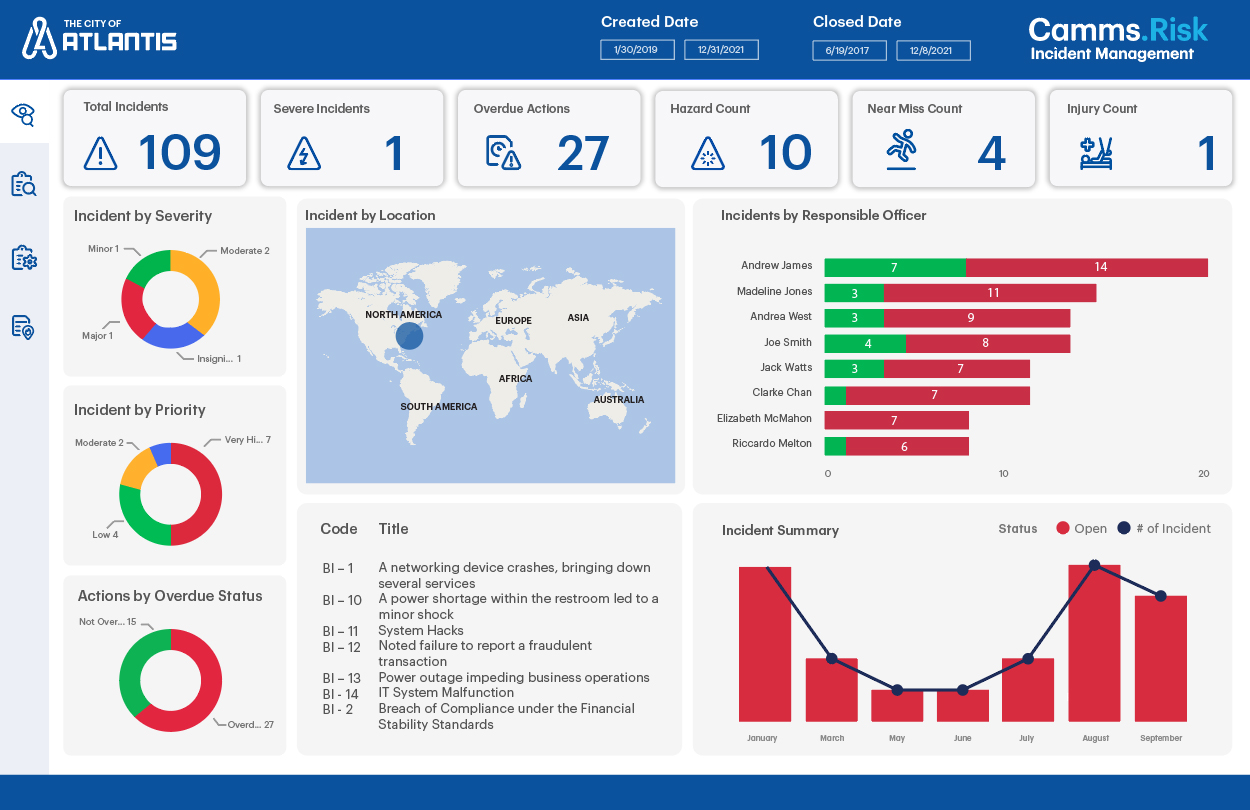
 Camms.Incident Dashboard
The Reporting Hub operates on its motto “Focus on Analysing Data, Not Preparing It!”. Our reporting experts are dedicated to preparing dashboards with the data generated from your Camms solutions so you can analyse and understand what steps to take next or what to cut back on.
You can schedule an appointment to speak to a Reporting Agent who can help you with creating, customising, and modifying Power BI dashboards.
Finally, you can also choose between designing the dashboard in-house, having your team trained or having one of our Reporting Agents prepare it for you.
Given most of our Reporting Agents are Microsoft Power BI certified, we will assist you to navigate your Power BI journey, incorporate this reporting capability into your business model and help you analyse data like never before.
Mitigating Risk & Fraud
Analysing data to understand possible risks ensures that there are no loopholes in terms of governance protocols. Efficient data and analytics capabilities will deliver optimum levels of fraud prevention and overall organisational security. This also allows companies to quickly detect potentially fraudulent activity and anticipate future activity, as well as identifying and tracking perpetrators.
In addition, data management alongside efficient and transparent reporting of fraud incidents will result in improved fraud risk management processes.
Reduce Operational Costs
Data analysis allows a business to recognise which products, departments are performing poorly or which areas in your business need more resources and money. This helps make decisions about investments, scaling back and so on.
Better Problem-Solving Methods
Data provides businesses with a lot of information. You can see where this progression is leading. Data analysis helps businesses make the right choices and avoid costly outcomes.
You Get More Accurate Data
Data analysis helps businesses acquire relevant, accurate information, suitable for developing future marketing strategies, business plans, and realigning the company’s vision or mission.
Are you ready to take your organisation to the next level with detailed reporting, successful data analysis and filtering to appeal to every stakeholder?